Merchant Insights Tutorial
The Merchant Insights API endpoints return data in JSON format about your customers. This page will show you some useful guides and tutorials to get you easily started.
BASE URL: https://datasuite.netsfuturepayments.eu/v1/merchantInsight
Required
To get started you need following:
Subscription key
Tutorial 1: Local Web Client
Getting started sometimes requires long setup and different configurations. Sometimes you might just want to see how quick the API’s response is, what is the format of a response or to see a size of it. To get you all these answers right away, use our Local Web Client which is a part of a Documentation. Remember, you still need a Subscription key.
Step 1
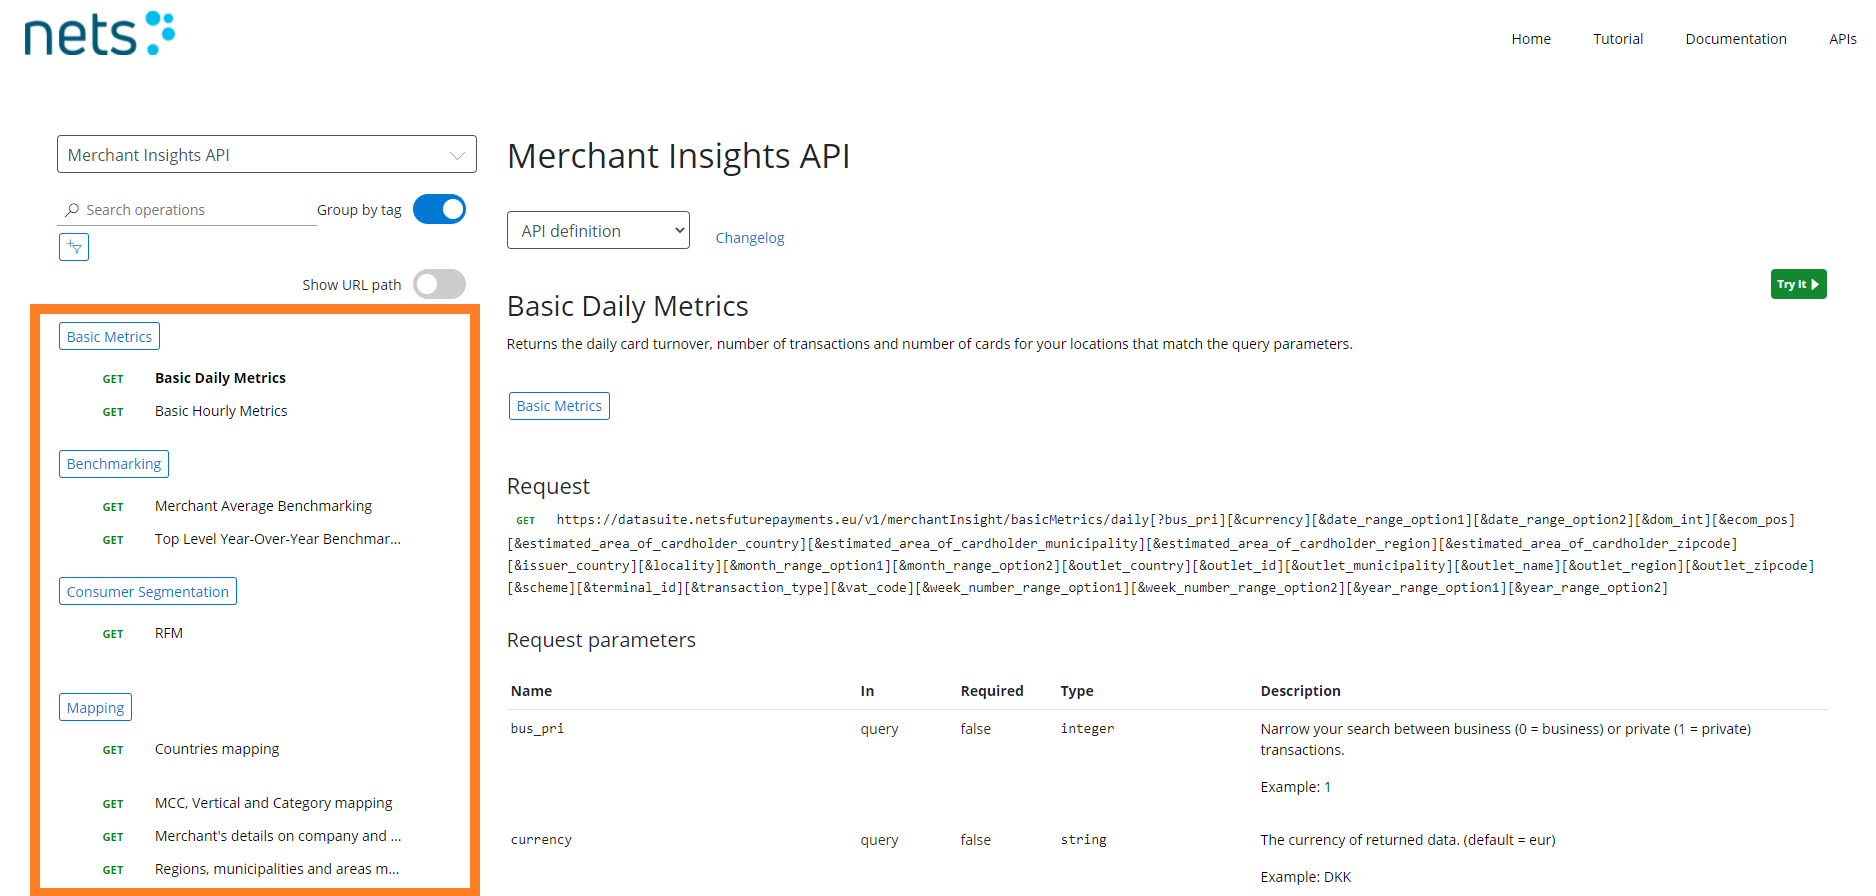
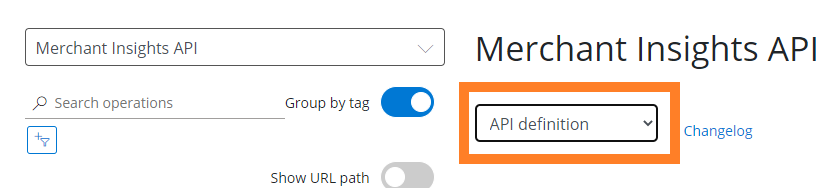
Navigate to APIs and open Merchant Insights API. Choose an endpoint of your interest (Orange square) and click on green Try it button.
Step 2
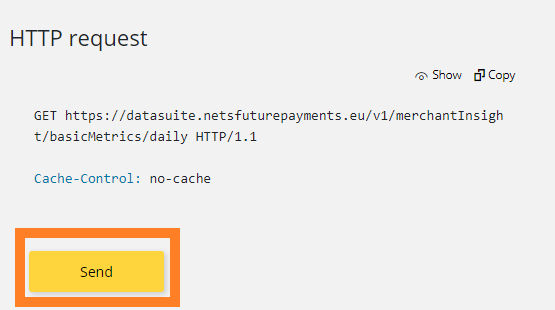
Fill in all required fields, including a Subscription key and hit Send button. You should receive a response within couple of seconds. Congratulations! You have just successfully used our Local Web Client.
Subscription_key :
Filter
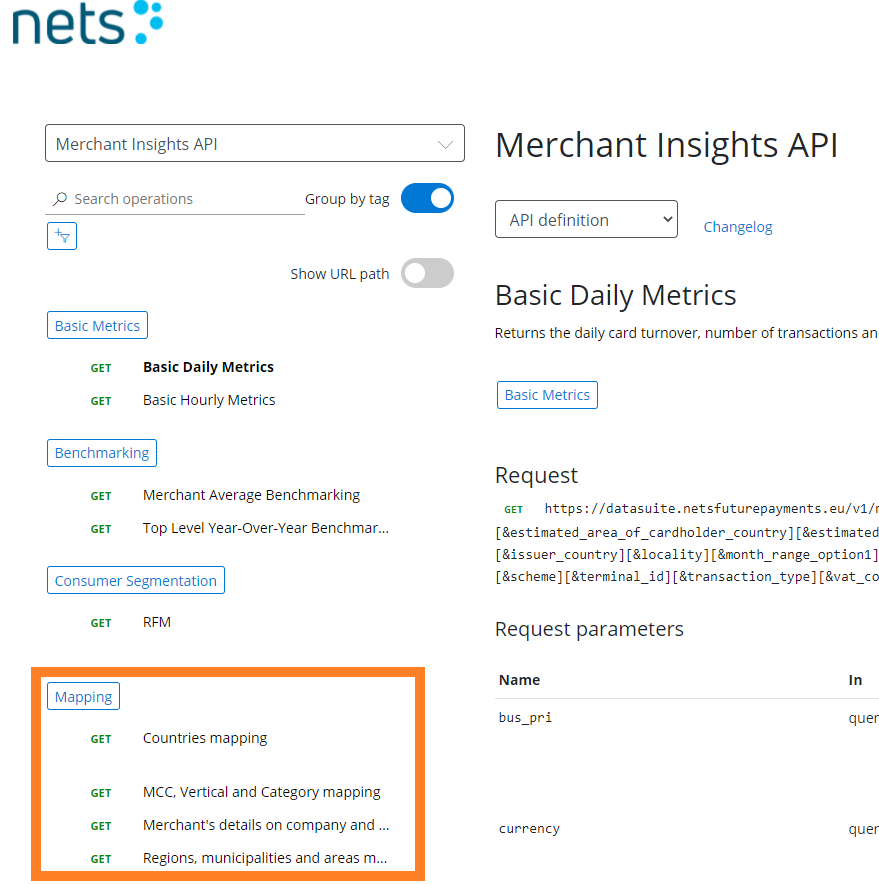
First you wanna figure out what the category codes are for each category, and for this there is a mapping endpoint, which will return all the needed information.
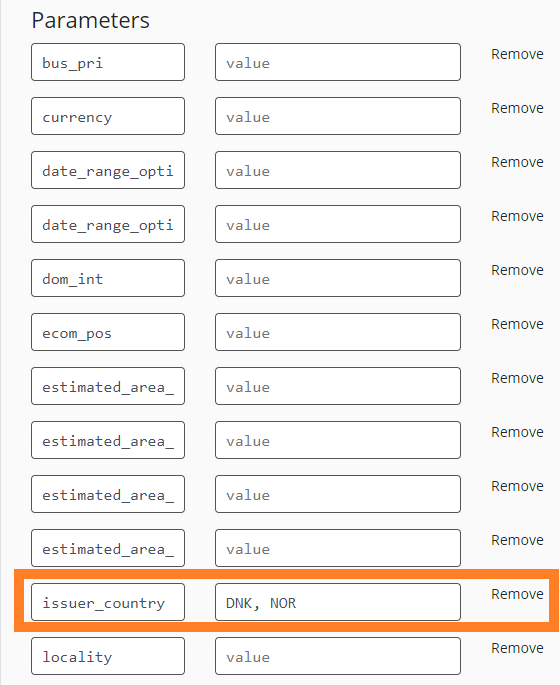
If you wanna use the filters and test them, you can fill in values in the parameters as seen in figure below. If the parameter has type array and you wanna add more values, you just add it with comma as separators, like seen in the figure below, where we filter for both DNK and NOR in issuer_country.
Tutorial 2: Postman
Postman is an application used for API testing. The HTTP client tests HTTP requests, utilizing a graphical user interface, through which different types of responses need to be validated. To get started with Postman and Merchant Insights, here is a quick guide (Example for index).
ALL REQUESTS ARE GET REQUESTS
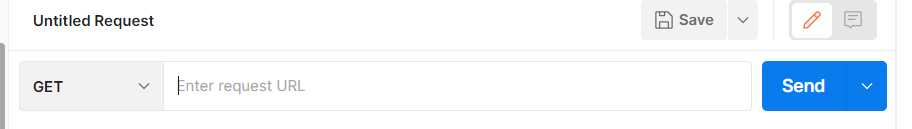
Step 1:
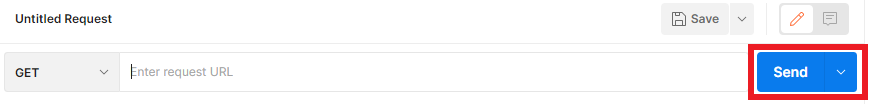
Enter the URL in the request field and be sure the request is set to GET:
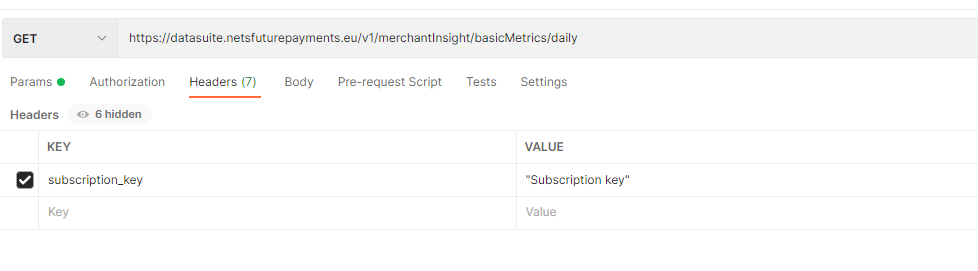
Step 2:
To authenticate fill in subscription key in the header:
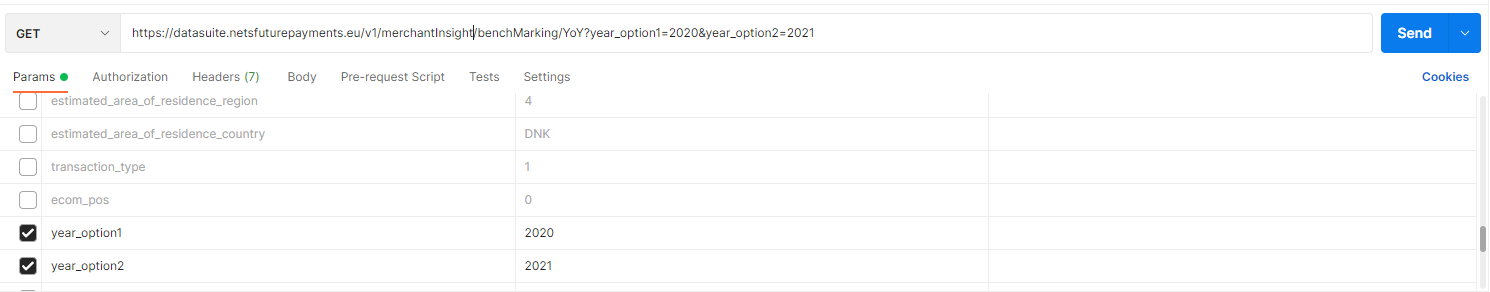
To add the required inputs use params (Here it is year options, which are required):
Step 3:
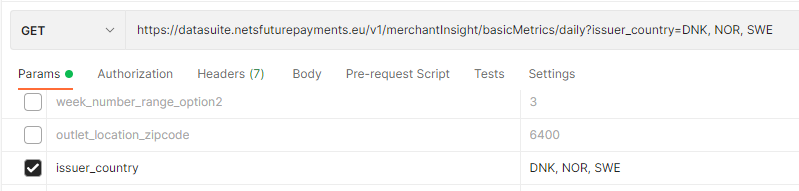
Filters can be added in the "Params" tab (here the date range is set):
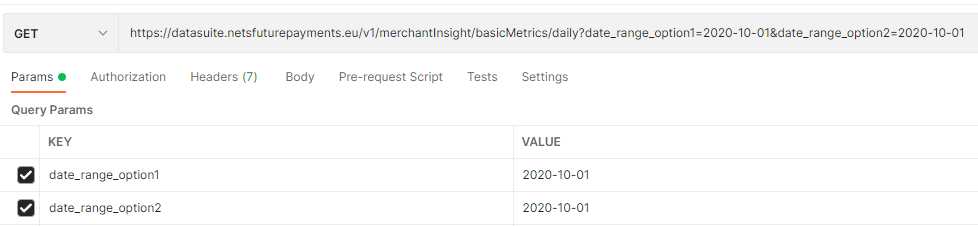
If a filter is an array, just add more by use of comma as separator:
You should now be ready to do a request and get the response, by clicking send.
Tip:
To get you quickly started, you can download an OpenAPI specification file from Local Web Client from Tutorial 1.
Tutorial 3: Microsoft Excel
Excel supports pulling data from a wide variety of data sources. The basic process is that you first identify the type of data source and then the location. This tutorial will demonstrate a data import from Merchant Insights API endpoint: BASE_URL/mapping/geographical
Step 1:
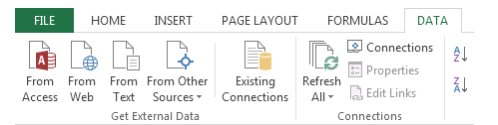
We tell Excel that we want to retrieve data from an external source by first identifying the type of source. This is done by selecting the appropriate ribbon icon from the Data tab as shown below
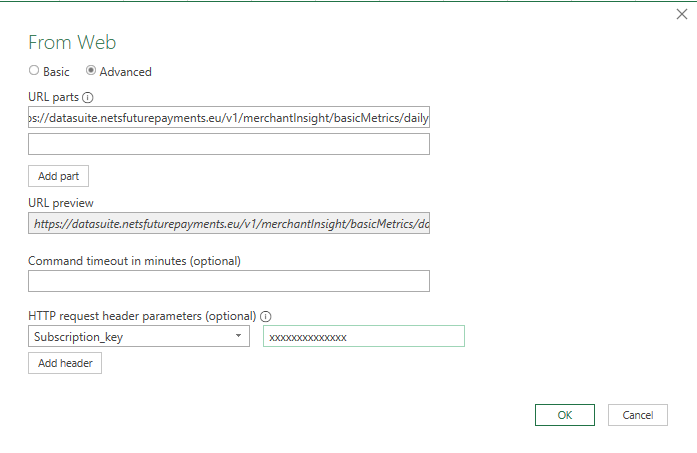
Step 2:
Our goal is to get data From Web. Fill in the connection wizard as shown on a picture bellow. Remember to type in the subscription key value into the request header parameters.
Tip: You can use Local Web Client from Tutorial 1 and just copy & paste URLs with all parameters. Be aware to copy only the URL without any extra parts.
HTTP HEADER: Subscription_key (The header is not listed in the dropdown, so you will need to type it in.)
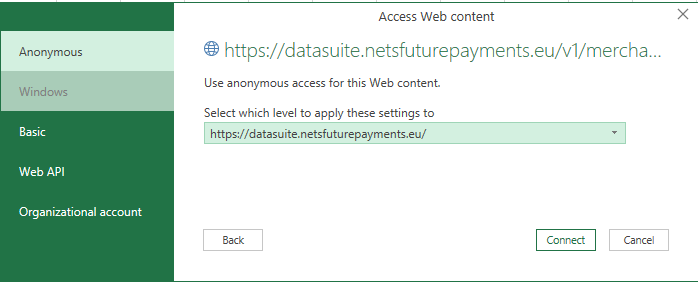
First time you request following box will appear, and here you just need to click "Connect".
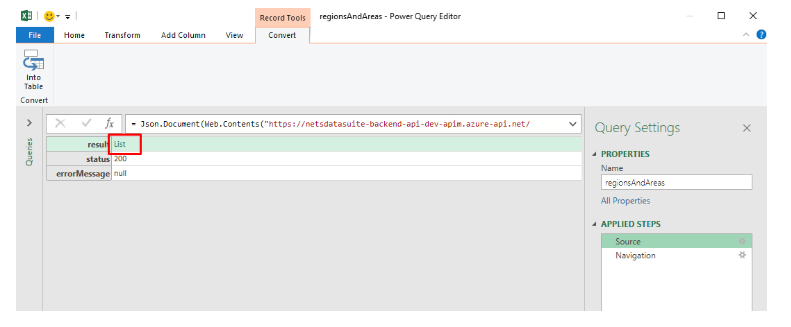
Step 3:
Start by finding the list in the data. Click through any single records until you find a list. Click it to open the list of Records or Lists.
Step 4:
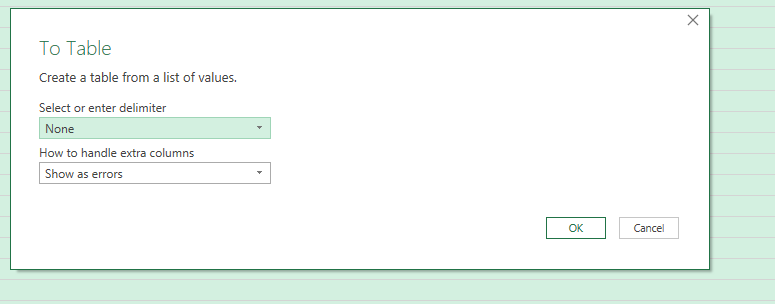
One you have found the list you are looking for; the list needs to be converted to a table for Excel to use. Click “To Table” to convert it.
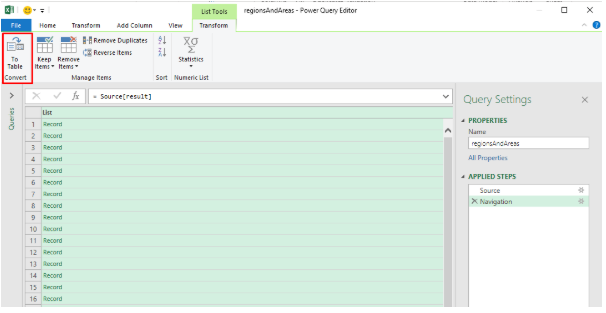
When you click "To Table" following will appear. Here you just need to click "OK".
Step 5:
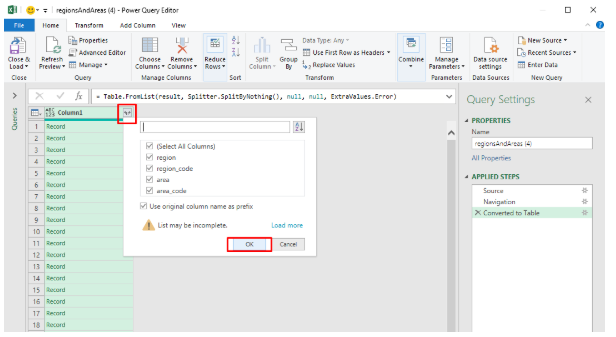
Once you have the list as a table, you need to specify which columns you want excel to make use of. Click the icon with two arrows pointing away from one another to expand the table. You may want to rename the table before doing this. To do so, double click the name and type a new one.
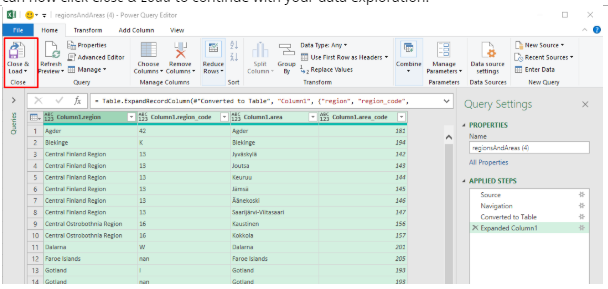
Step 6:
We are almost done! As shown on a picture bellow, all data were loaded into the table. You can now click Close & Load to continue with your data exploration.
Tutorial 4: Qlik
Step 1:
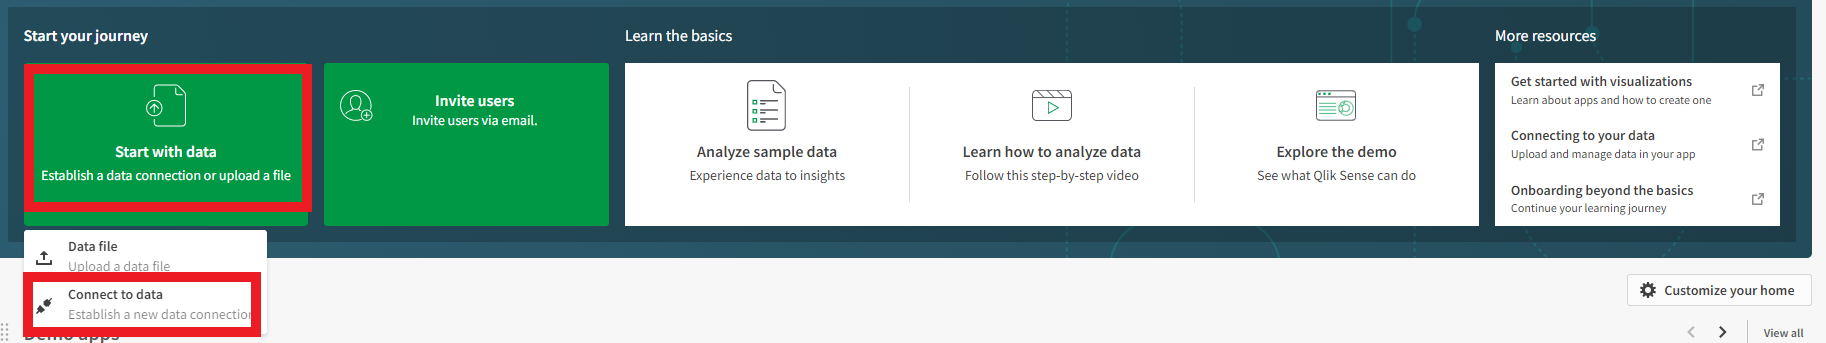
In this tutorial, we will show how to get data in to Qlik, by using the REST service in Qlik. First when you are logged in to the Qlik cloud portal, you need to establish a new data connection, which is done by clicking at "Start with data" and then choose "Connect to data".
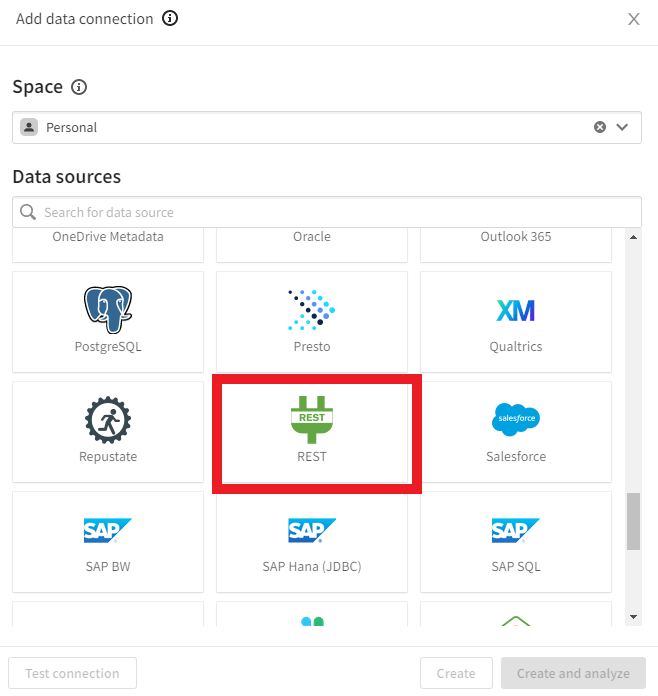
Step 2:
Then a window with all the supported data connections for Qlik is shown. Scroll down to find the "REST", and click at it.
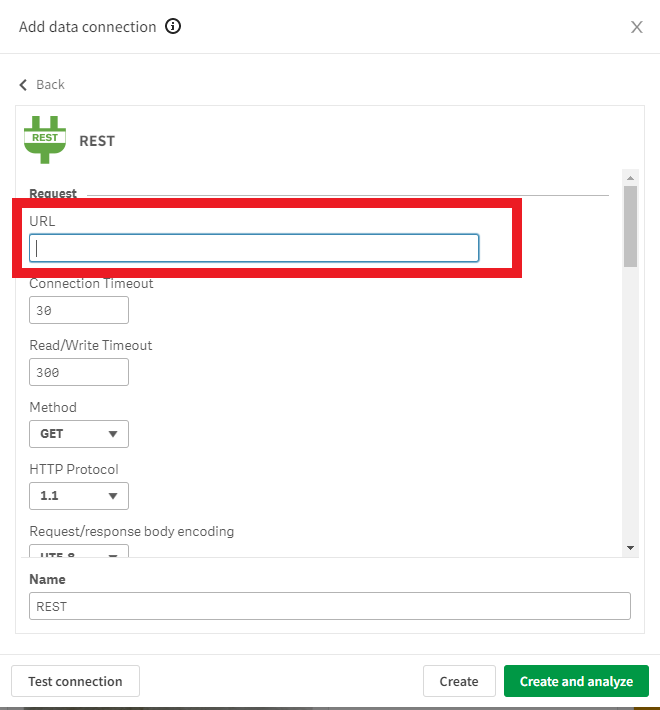
Step 3:
Now you need to provide the URL, which should be used for the data connection. For this you can use the local web client, and copy the URL from the wanted endpoint. Do not specify any filters now, this is done in next step.
An example of an URL: https://datasuite.netsfuturepayments.eu/v1/merchantInsight/basicMetrics/daily
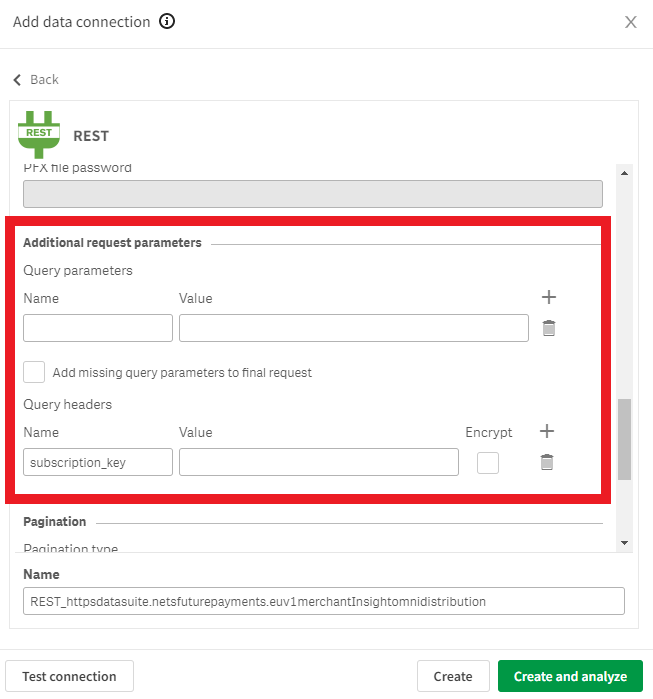
Step 4:
After filling in the URL, scroll down to the section called "Additional request parameters". In this section you need to fill in the subscription_key in to the "Query header". In the value filed fill in your provided subscription key.
Above the "Query headers" is the "Query parameters" which can be used for adding filters. As an example you want only e-commerce, and the you fill in the name of the filter: "ecom_pos" and the value is then 0.
If you want more filters, you add more by clicking the "+" button in the "Query parameters" section.
When you are done adding filters, it is possible to test the connection, and if the test is a success click the green button "create and analyze".
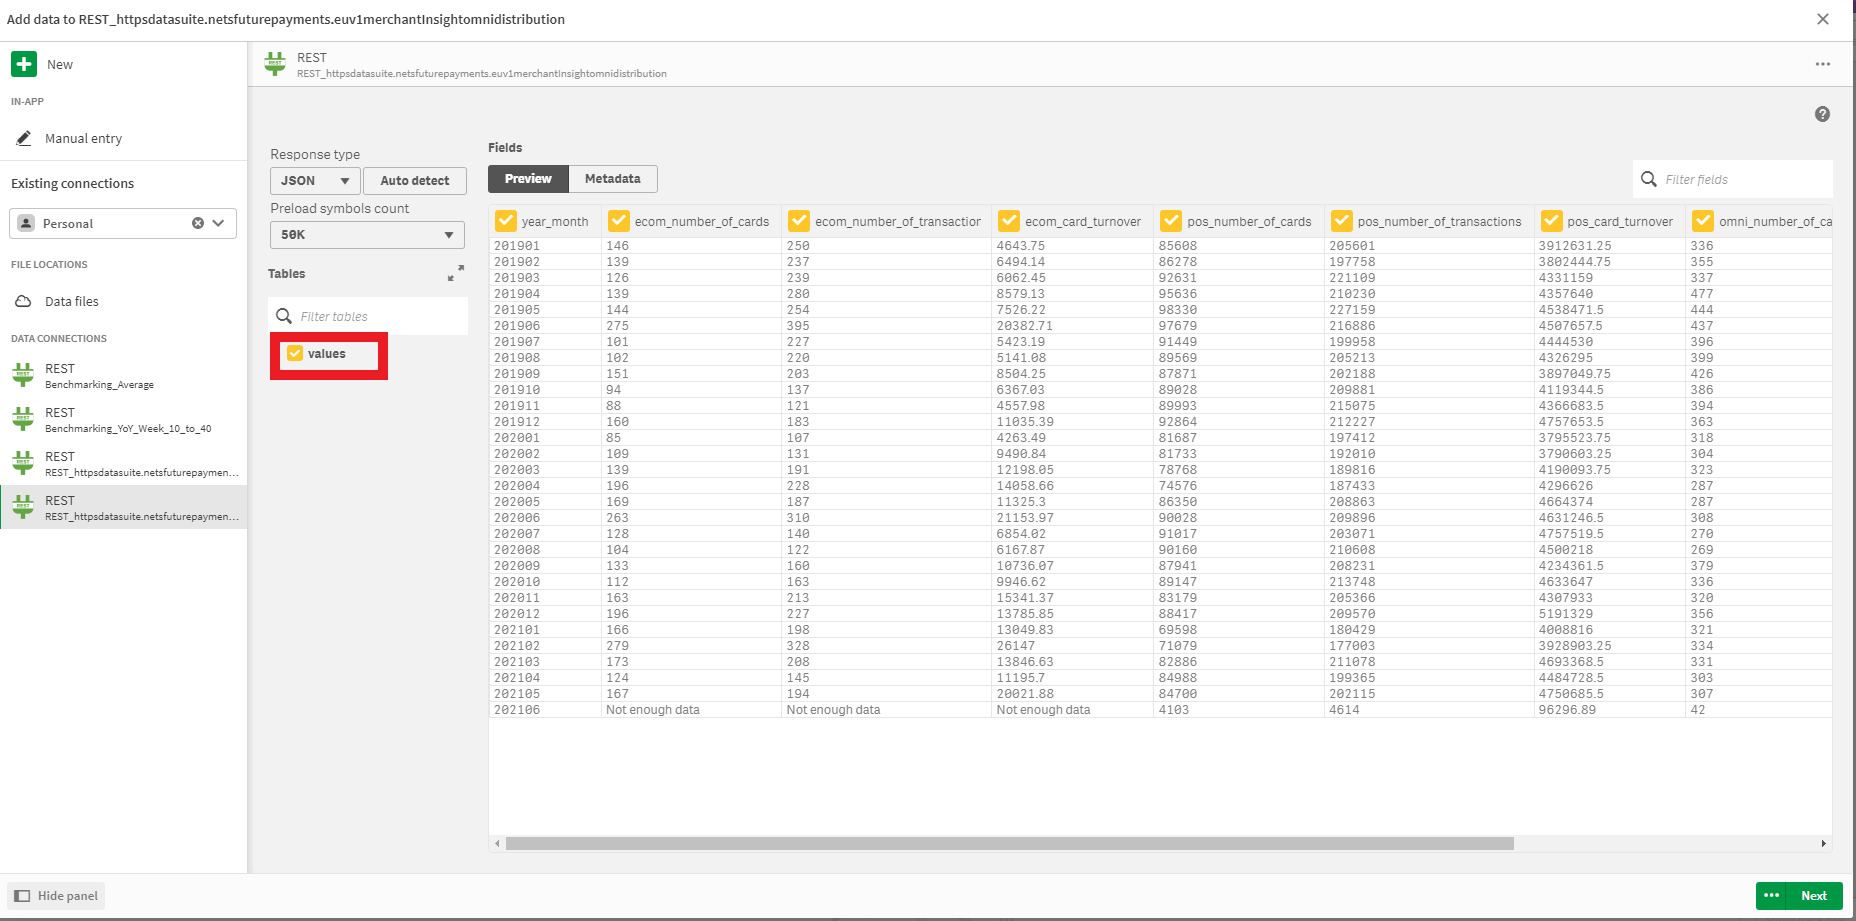
Step 5:
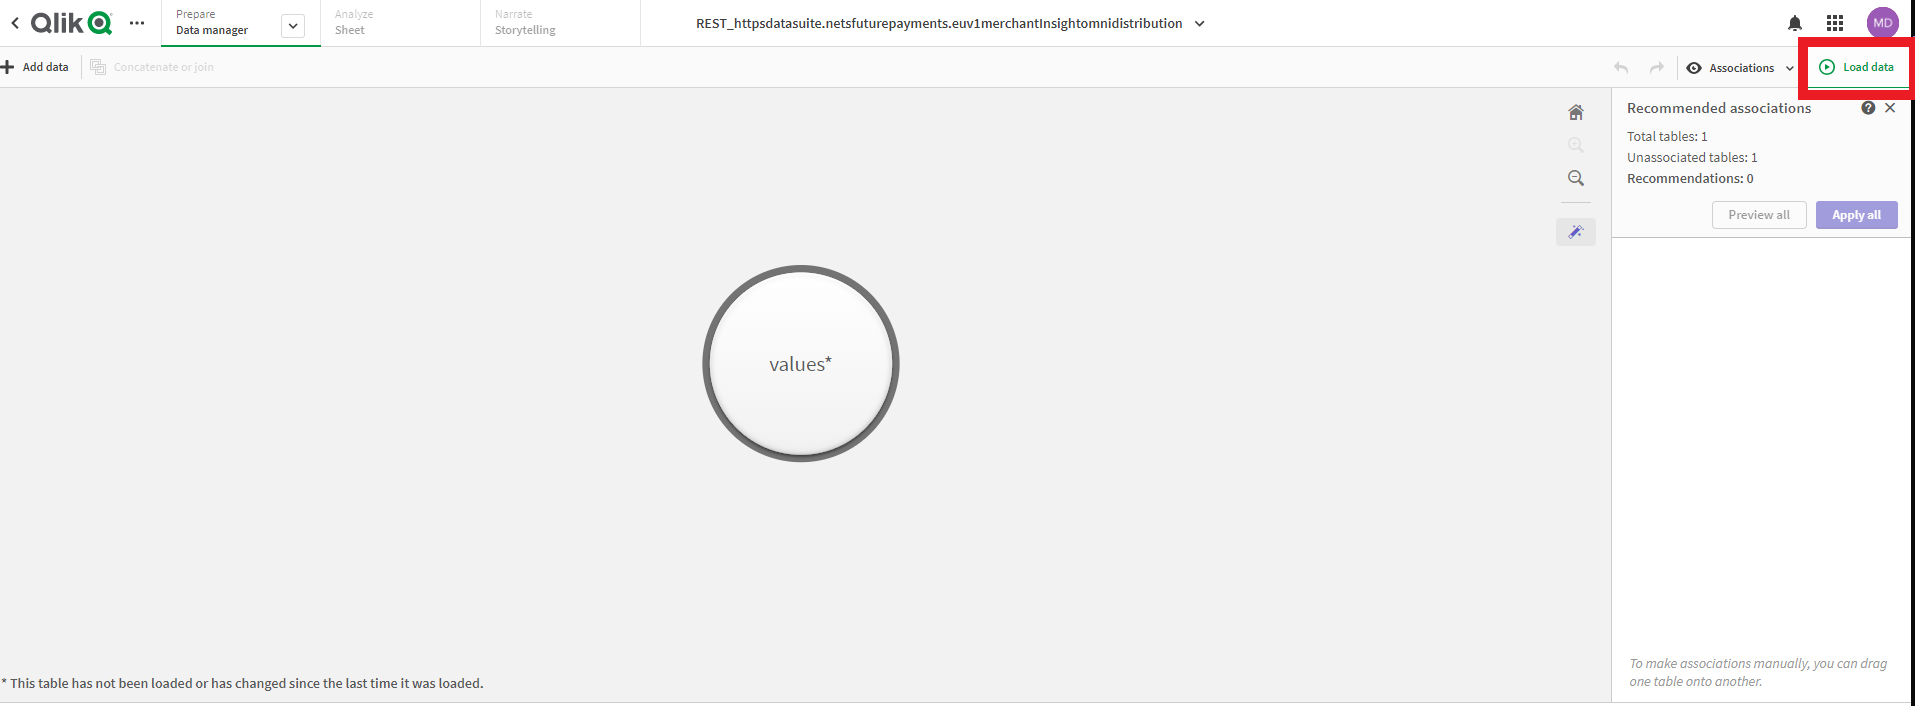
The endpoint is now called and you will get a preview of the data in a table by clicking on the the left, where the response values in this example is called "values". It can have different names, but will always be one click here. Then click the green button "Next"
Step 6:
You are now in the data manager where you can link to other data, and work with the data like you want, before you want to create graphs. When all good here, you click "Load Data".
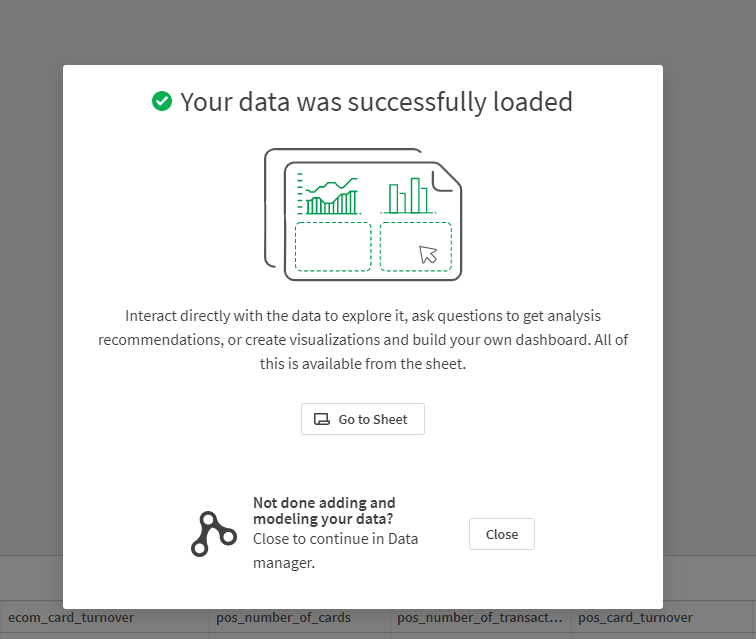
Step 7:
You will now be provided with a message saying "Your data was successfully loaded". From here you can go back and add more data or click "Go to sheet", where you can start create graphs.
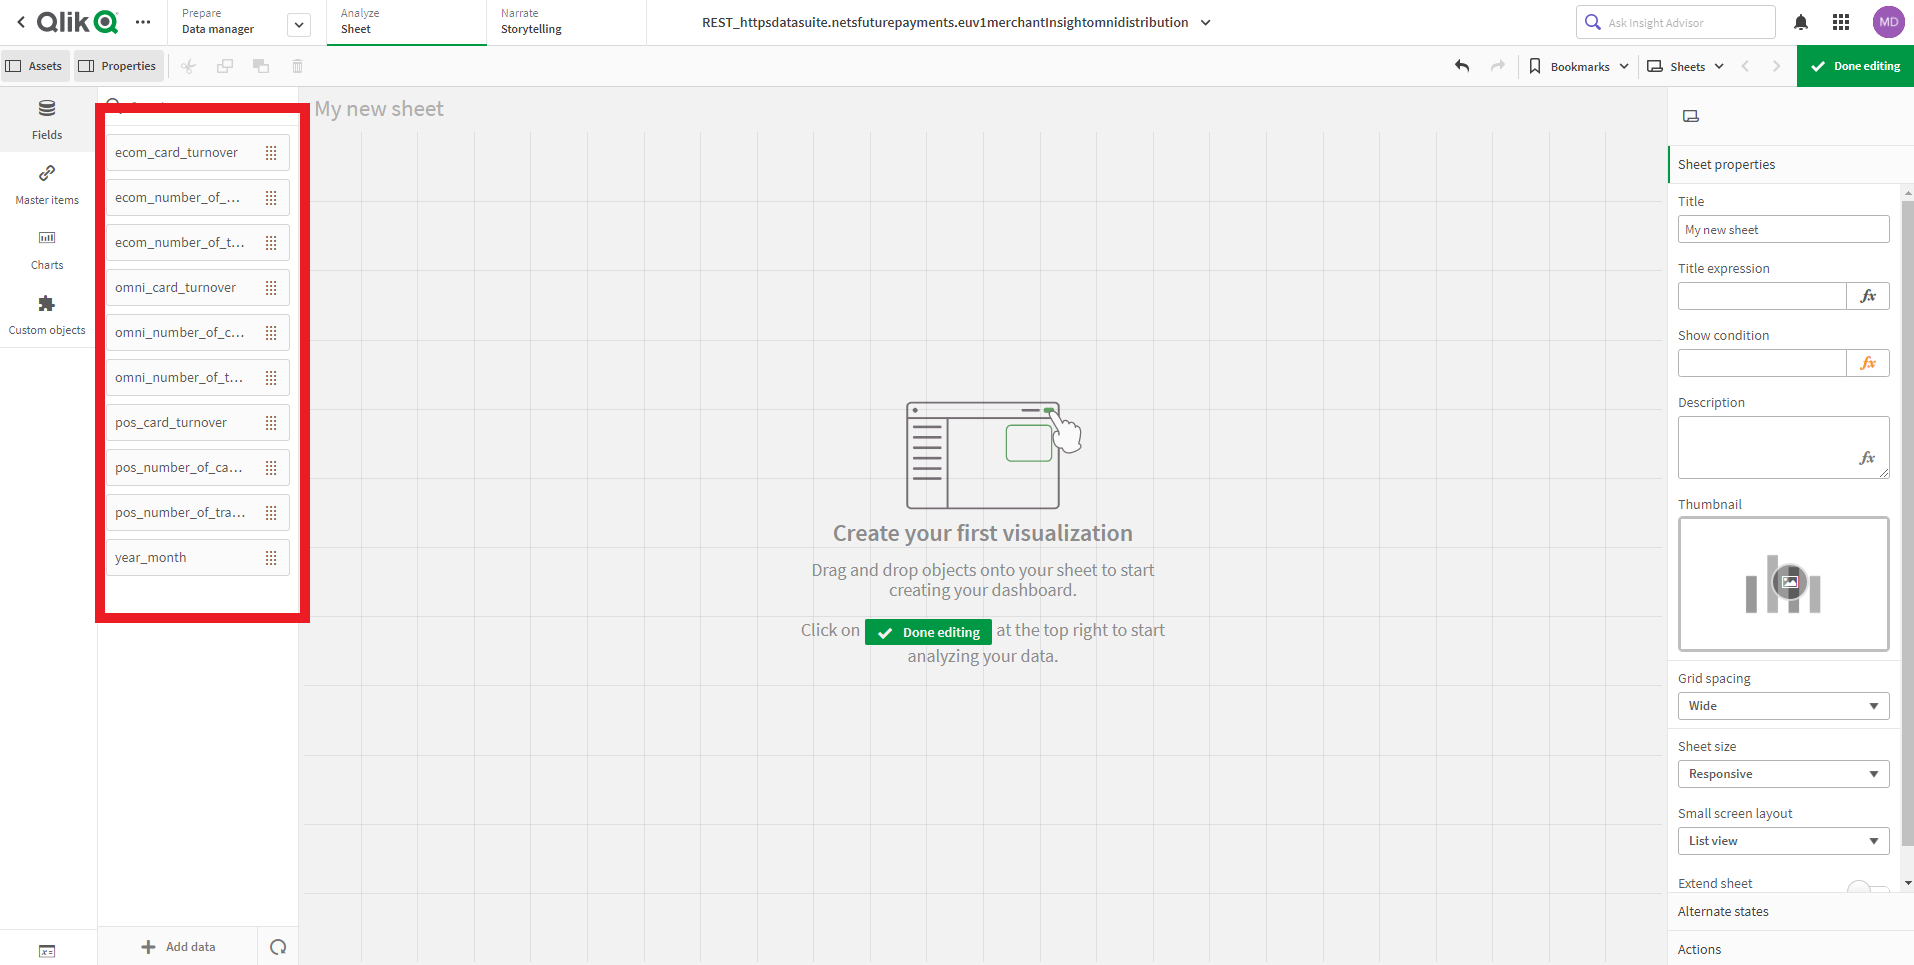
Step 8:
When you click "Go to sheet", you will now see the data in the left side of the screen, with the headlines of the columns. And you are now ready to add graphs and use the data in the graphs by drag and drop.
Tutorial 5: Code snippets
Let us help you when starting to build a custom application. The Local Web Client interface, described in Tutorial 1, includes code snippets for different programming languages. Have a look and find the one which the suits you the best. Good luck!